In my previous article, I introduced the Progress Metric Framework as a tool for measuring the success of pre-market ventures, where expediting time-to-market needs to be balanced with risk mitigation through evidence-based decision-making. In this article, I will guide you through the practical implementation of the framework.
A Unified View of a ‘Product’
The starting place for any type of funnel measurement is a unified view of what a 'product' actually is. There are many ways an organization can view a 'product,' especially in a pre-market state of development.
We found the most straightforward and useful view of a pre-market 'product' is the business model. When used as a documentation tool, as opposed to a hypothesizing or diagnostic tool, the nine building blocks of a business model can be applied effectively to the development of new products and the reduction of uncertainty.
This approach incorporates a more holistic view of the product as it resides in the 'ecosystem' of the business model. It forces focus on the interaction between what a business offers to their customers and how that offer produces value for our business.
In this context, we adopted a foundational definition of a business model: A set of assumptions/hypotheses on how a team or organization creates, delivers, and captures value (until validated).
The ‘product’ is the business model and our ‘product development teams’ are actually ‘business model development teams.’ Our shift from product thinking to business model thinking became instrumental in our product development approach.
Measuring Confidence
With a unified view of a ‘product’ as a business model, we then needed to create an effective way to evaluate the progression of that business model to produce a stable metric. This evaluation had to account for a balance between accelerating product development cycle time and derisking critical assumptions.
After numerous iterations, we found the most effective evaluation method was to measure confidence. The objective confidence the organization had in the evidence produced for the product was the strongest indication of product development progression.
What emerged was what we now call a Confidence Score.
A Confidence Score is a measure of evidence across the entire ecosystem of the business model. Confidence is measured by both the strength of the evidence and the reduction of risk through the testing of risky assumptions in a particular business model.
To measure confidence objectively, we employ four dimensions: Customer Do vs. Customer Say, Real World vs. Lab Context, Data vs. Opinion, and High Fidelity vs. Low Fidelity.
Customer Do vs Customer Say
"Customer say" refers to the preferences or opinions expressed by customers verbally or in writing, indicating their preferences, concerns, or satisfaction levels. Think; customer surveys, focus groups, and “market research.” On the other hand, "customer do" refers to the actual actions taken by customers, such as making purchases (monetary or otherwise), making choices, or engaging with a product or service, which often reflect their true behavior beyond just preferences.
We have more confidence in evidence generated through “Customer Do” and less confidence in evidence generated through “Customer Say.”
Real World vs Lab Context
"Real World" refers to the generation of evidence in environments and situations outside controlled settings where products are used in diverse and dynamic conditions, providing authentic insights into user behavior and performance. In contrast, "Lab Context" pertains to controlled experimental setups where products are tested under specific conditions typically slanted toward the businesses advantage.
We have more confidence in evidence generated through the “Real World” and less confidence in evidence generated through a “Lab Context.”
Data vs Opinion
"Data" refers to factual information collected and analyzed systematically providing objective insights into trends, patterns, and behaviors. "Opinion" represents subjective viewpoints or beliefs based on personal experiences, perspectives, or biases, which may not always align with empirical evidence or data-driven conclusions.
We have more confidence in evidence generated through “Data” and less confidence in evidence generated through “Opinion.”
High Fidelity vs Low Fidelity
"High fidelity" refers to experiments that more closely resemble the final product or product feature, providing richer opportunities for customer interactions with critical behavioral assumptions. Conversely, "Low Fidelity" refers to simplified or rough drafts of product features or prototypes, focusing on basic behaviors and interactions.
We have more confidence in evidence generated through “High Fidelity” experiments and less confidence in evidence generated through “Low Fidelity” experiments.

The organization can then use a Confidence Score to evaluate the evidence generated for a particular product in development. One of the keys to unlocking more accurate confidence scoring is to frame confidence in concrete decision making as it relates to resource allocation and/or funnel advancement and/or investment.
The question becomes: Are we adequately confident or inadequately confident to make a well informed decision to advance this product to the next phase in the funnel and/or put further resources into this product? To what extent? And why?
The answer to this question is expressed in a Confidence Score to provide feedback to the product team and to scale into an overall Progress Metric.
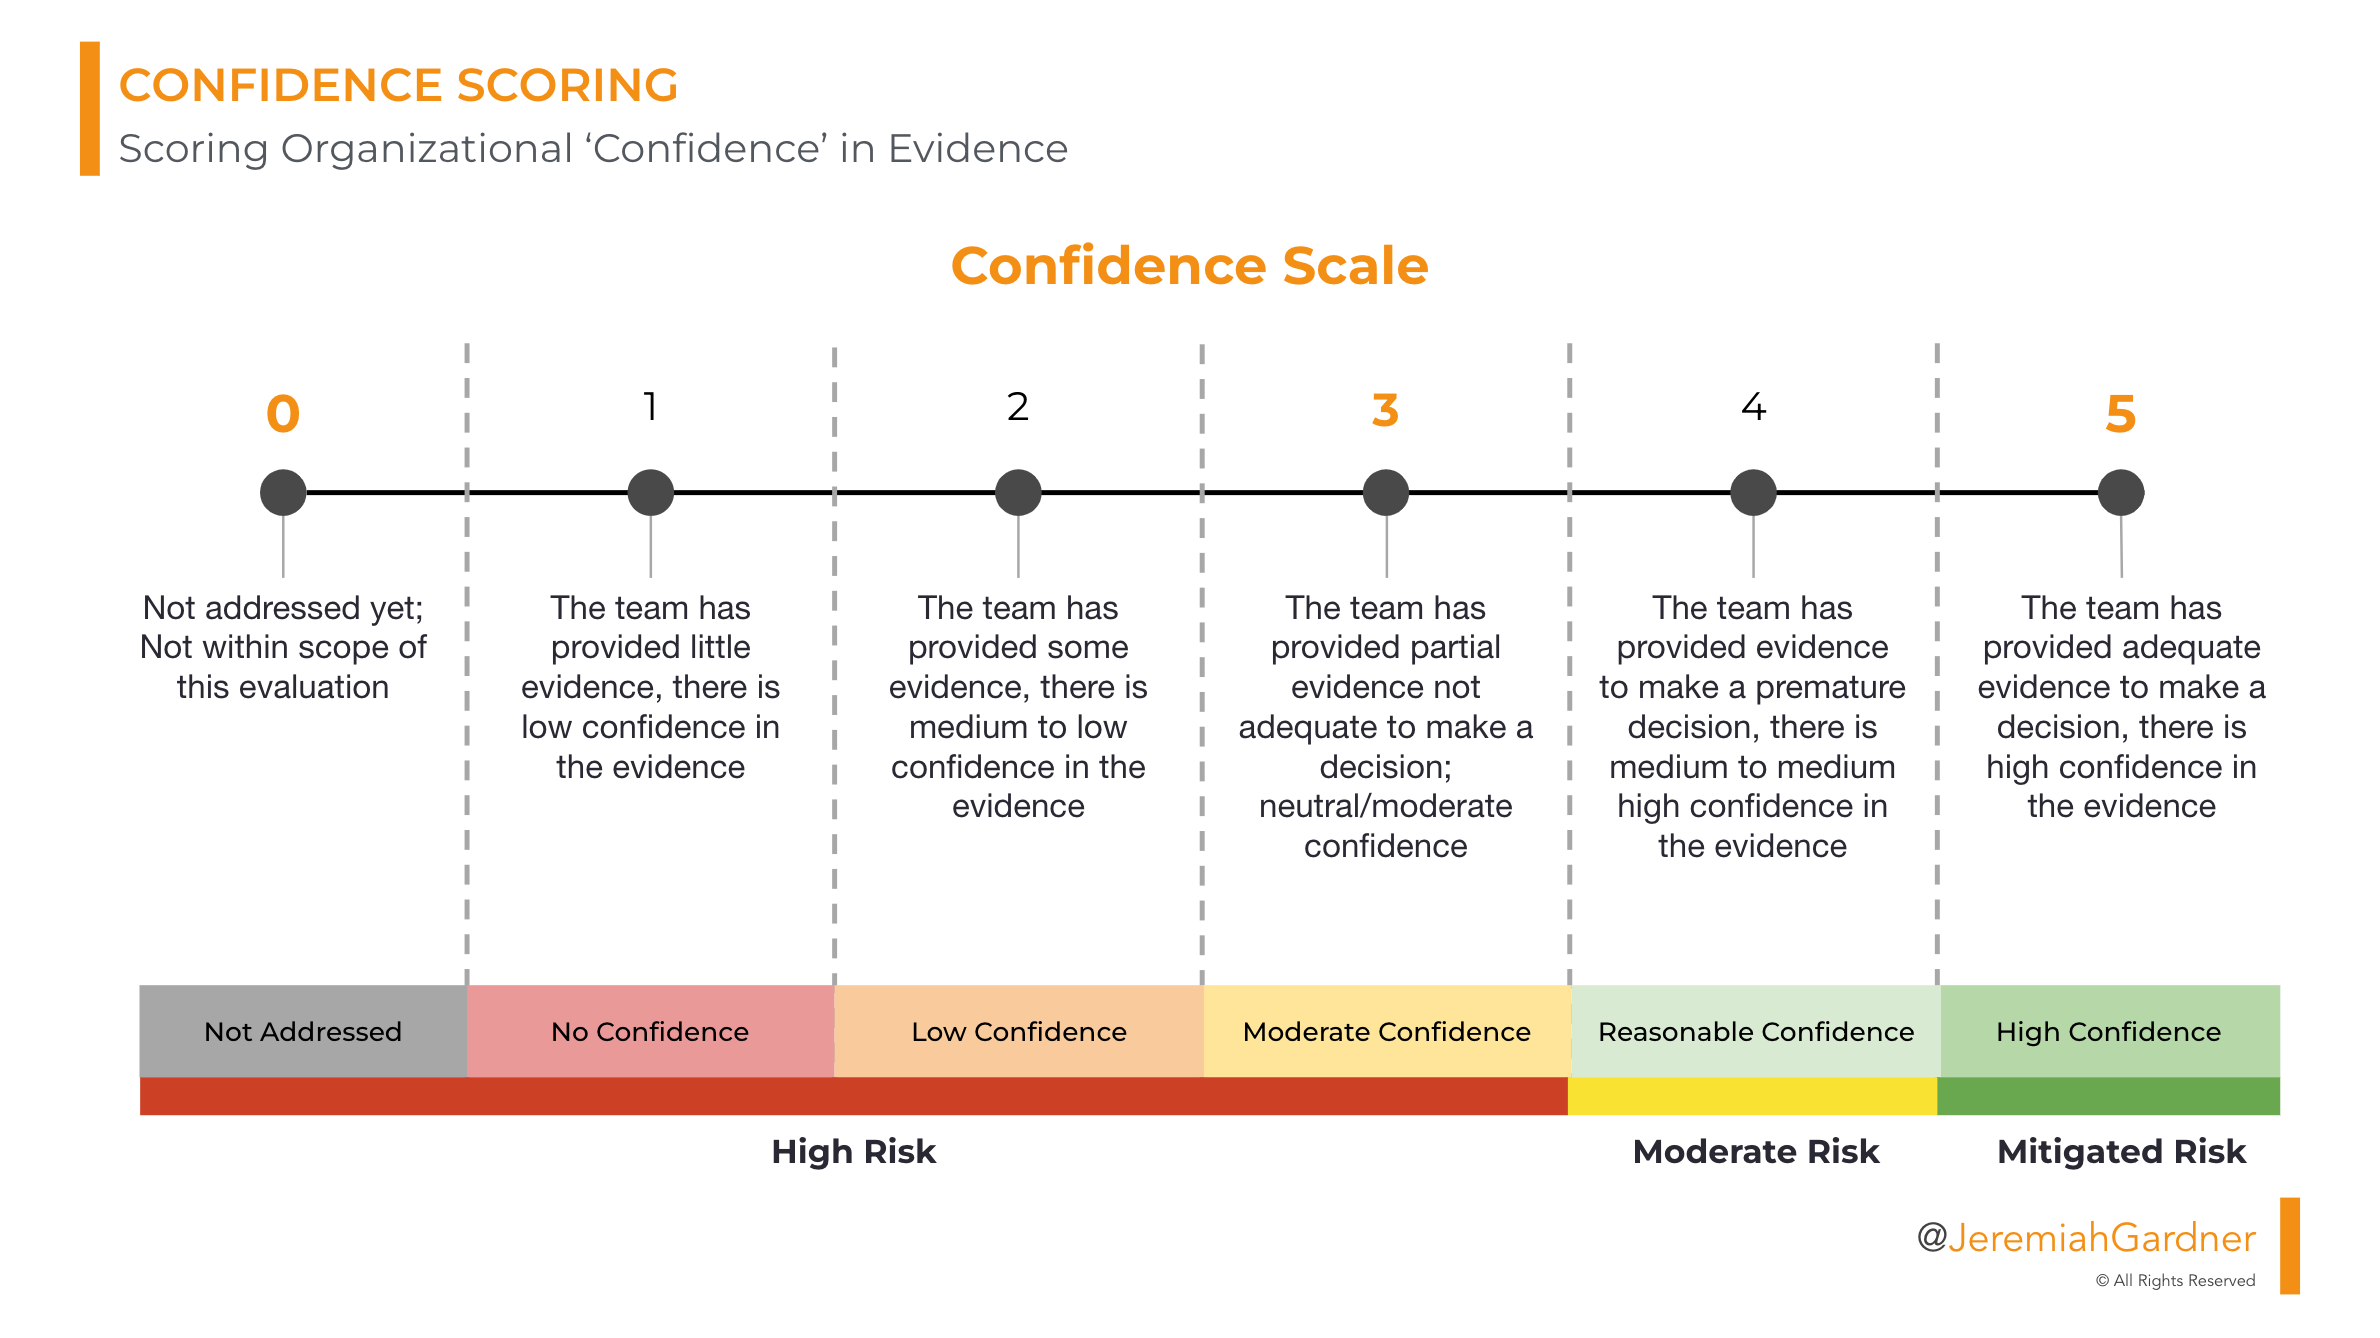
Confidence Score Scale
- 0 = Not addressed yet; Not within scope of this evaluation
- 1 = The team has provided little evidence, there is low confidence in the evidence
- 2 = The team has provided some evidence, there is medium to low confidence in the evidence
- 3 = The team has provided partial evidence not adequate to make a decision; neutral/moderate confidence
- 4 = The team has provided evidence to make a premature decision, there is medium to medium high confidence in the evidence
- 5 = The team has provided adequate evidence to make a decision, there is high confidence in the evidence
Calculating the Progress Metric: Aggregate Confidence in the Business Model
A Progress Metric is the aggregate result of confidence in a developing business model. It is utilized over the progression lifecycle of a new product through a structured product development model. In the simplest terms, the Progress Metric measures early stage products through objective confidence, as measured by the Confidence Score, in the evidence-based market opportunity of that product.
To calculate the Progress Metric we aggregate the Confidence Scores across the nine building blocks of the business model, weight each component according to risk factors (industry and/or market and/or others), and produce a single ‘metric that matters' to measure the progression of a pre-market product.
Progress Metric Ranges
The resulting Progress Metric provides a clear indication of the overall progression of the developing product while giving us line of sight into areas where evidence is strong within the business model and where a team needs to produce stronger evidence.
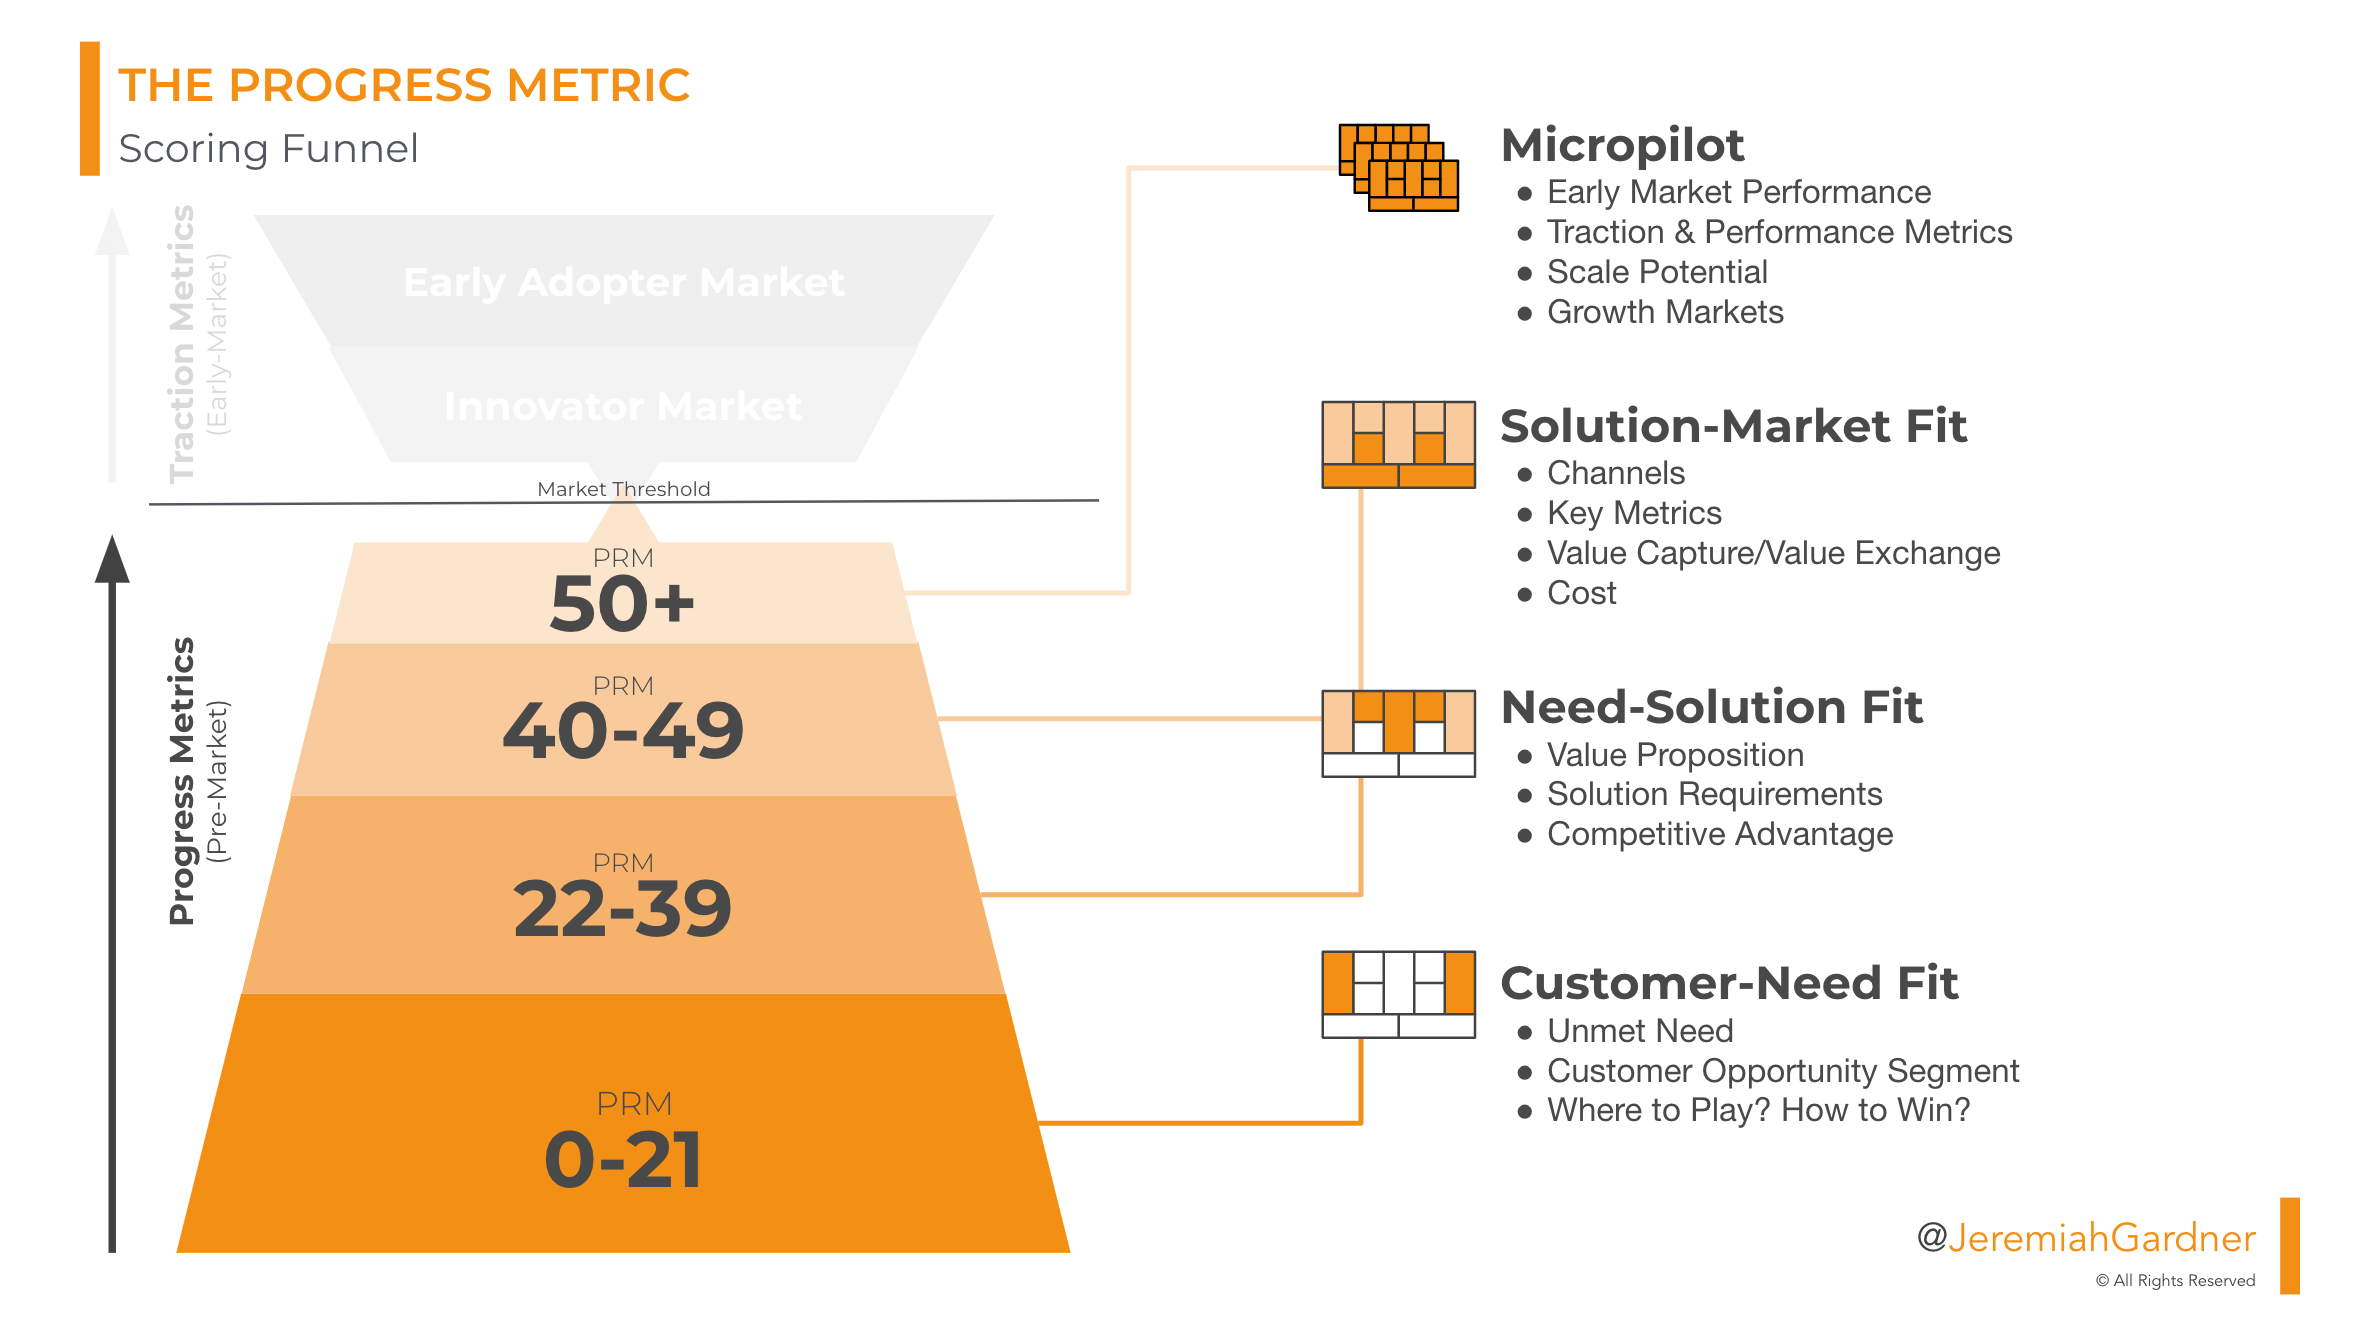
Progress Score Ranges (In a mature Product Development Model)
- Customer–Need Fit = 0 -21
- Need–Solution Fit = 22 - 39
- Solution–Market Fit = 40 - 49
- Micropilot (Ready for pilot) = 50+

The purpose of consistent Progress Metric scoring is to give both organizational leadership and the product development team a "snapshot in time" of the development of their product. This is not intended to act as a judgment evaluation on a specific team. Instead, it is a marker of where a team’s product progression currently is and a tool to identify strengths and opportunities for growth.
Successful product leaders and teams have utilized the Progress Metric to:
- Shape sprint planning and backlogs
- Drive progress between scores
- Inform key decisions for their development and for the portfolio
- Generate conversations and deeper dives into accelerating and/or bolstering progress
With consistent evaluations, product portfolio leaders can begin to see the trends, swings, tendencies, and ultimately the movement of not just a single product but the entire product development portfolio.
The Progress Metric Framework: A Case Example
(Note:For the sake of anonymity I will generalize the team, organization, and numbers outlined, however, the case is based on a real application of the Progress Metric Framework).
Let’s take a case example. Team Green receives a Progress Metric score of 25 in their last evaluation. This score provided the portfolio leadership both immediate information and short-term areas for examination and potential course correction.
Off the top, we understand that the product is in the Need-Solution Fit phase of development within our product development model. Does this track with our expectations? Is it within the range of expected timelines? When taking these factors into account, does this square with our investment to date and our expectation of return?
In this case, the score was lagging behind the timeline expectations portfolio leadership had anticipated. This triggered a deeper exploration into the score.
Taking a closer look, we see that the Confidence Score in the Customer Need component of their business model has consistently decreased over the last three evaluations. This would warrant a further examination into the causes of this trend. Is the market changing? Is new evidence signaling we are focusing on the wrong need? Has a competitor product come to market recently that is effectively eliminating the need?
We also see the Confidence Score in the Revenue component of their business model receive a dramatic increase since the last evaluation. Is this due to that new competitor product successfully establishing a pricing baseline? Has a new development on the supply side drastically reduced the cost of manufacturing? Did an experiment into the potential for a different revenue model produce strong evidence?
In this case, indeed an unanticipated competitor product had entered the market successfully. Although the competitor product was actually intended to solve a different need, the usage of the competitor product effectively addressed the customer need that the product team had focused on.
In the end, four results occurred.
- The team spent the next few sprints focusing on the Customer Need they were addressing by generating deeper evidence for the line-by-line of the ‘Jobs to be Done’ and the ‘Pain Points’ associated with the ‘Unmet Need.’ This led to a better understanding as to how the market was shifting and why the new competitor product was effective.
- After sharing the evidence back with portfolio leadership, a collective decision was made to stop (or kill) the product and refocus the team on a new customer need.
- The cost-savings of this decision were calculated by investment finance to be over $15MM if the team had progressed to bringing the product to market.
- Team Green became a cultural case study for the organization in the celebration of ‘failing fast.’
In the next article in the ‘Introducing Progress Metrics Framework’ series, I will take a closer look at the application of the framework within an organization and address some key questions about the practical use of Progress Metrics. How do you actually produce a Progres Metric session? Who should provide scoring? And how many? How often should you score? How do these scores inform leadership and key stakeholders upstream in the organization?
